Difference between revisions of "NOAA POES TIP Demodulation"
(→Todo) |
|||
| (51 intermediate revisions by the same user not shown) | |||
| Line 1: | Line 1: | ||
==Problem Statement== | ==Problem Statement== | ||
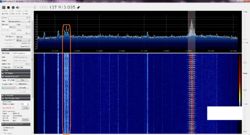
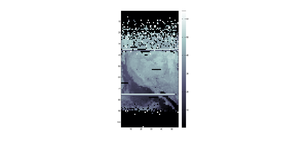
| − | While listening to NOAA APT signals I noticed a strange telemetry signal at 137.35 and 137.77 that tracked NOAA POES sats. At first I thought it was a second sat, but then I realized that the doppler shifts matched too closely. I found the handbook for the satellite constellation, which makes mention of a | + | While listening to NOAA APT signals I noticed a strange telemetry signal at 137.35 and 137.77 that tracked NOAA POES sats. At first I thought it was a second sat, but then I realized that the doppler shifts matched too closely. I found the handbook for the satellite constellation, which makes mention of a DSB or TIP signal |
[[Image:POES_waterfall.jpg|250px]] | [[Image:POES_waterfall.jpg|250px]] | ||
<br clear=both /> | <br clear=both /> | ||
| + | |||
| + | == Latest News == | ||
| + | * I gave a talk at HeatSync Labs on this project! [https://www.youtube.com/watch?v=HjBMxoHTjCk "Reverse Engineering NOAA and ARGOS Satellite - Hot Topics - 9th September 2016"] | ||
| + | |||
| + | * Matlab code has been ported to a standalone C program that anyone can use! [https://github.com/nebarnix/Project-Desert-Tortoise The Project Desert Tortoise Github Page! ] | ||
| + | |||
| + | * Output of the demodulator can be opened with [https://github.com/nebarnix/PDT-TelemetryExplorer Telemetry Explorer], a QT based application with more and more functionality added all the time. | ||
==Research== | ==Research== | ||
| Line 9: | Line 16: | ||
I can't actually find any instance of anyone using SDR to decode this signal. I decided that this needed to change :) | I can't actually find any instance of anyone using SDR to decode this signal. I decided that this needed to change :) | ||
| − | I found these documents which describe the modulation and format | + | I found these documents which describe the modulation and format. TIP stands for "Tiros Information Processor" (because the predicessors to NOAA sats were called TIROS) and is also called the DSB "Direct Sounder Broadcast" as it contains information about the earth environment. |
[http://ntrs.nasa.gov/archive/nasa/casi.ntrs.nasa.gov/19670025569.pdf] | [http://ntrs.nasa.gov/archive/nasa/casi.ntrs.nasa.gov/19670025569.pdf] | ||
[http://www1.ncdc.noaa.gov/pub/data/satellite/publications/podguides/N-15%20thru%20N-19/pdf/2.1%20Section%204.0%20Real%20Time%20Data%20Systems%20for%20Local%20Users%20.pdf] | [http://www1.ncdc.noaa.gov/pub/data/satellite/publications/podguides/N-15%20thru%20N-19/pdf/2.1%20Section%204.0%20Real%20Time%20Data%20Systems%20for%20Local%20Users%20.pdf] | ||
| Line 16: | Line 23: | ||
I discovered that this is a very old modulation scheme, dating back to at least the late 60's. The scheme is a BPSK that uses a modulation index of 67 degrees to preserves the carrier for tracking purposes. | I discovered that this is a very old modulation scheme, dating back to at least the late 60's. The scheme is a BPSK that uses a modulation index of 67 degrees to preserves the carrier for tracking purposes. | ||
| − | It is also Manchester encoded, which means that even though the stream is 8320 bps, it is encoded using double the number of symbols, or 16,640 sps. | + | It is also Manchester encoded, which means that even though the stream is 8320 bps, it is encoded using double the number of symbols, or 16,640 sps. The reason for this strange number is that there are 10 minor frames per second, and there happen to be 104 bytes per frame. Math :) |
==GNU Radio Script== | ==GNU Radio Script== | ||
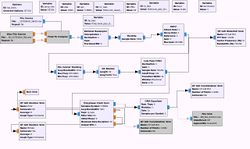
| − | I wrote a GNU radio workflow to prepare the data for demodulation. http://nebarnix.com/sdr/ | + | I wrote a GNU radio workflow to prepare the data for demodulation. http://nebarnix.com/sdr/latest_POES.grc |
[[Image:POES_GRC_flow.JPG|250px]] | [[Image:POES_GRC_flow.JPG|250px]] | ||
| − | File Source->Throttle->AGC2->Carrier Tracking PLL-> | + | File Source->Throttle->AGC2->Carrier Tracking PLL->DC Block Filter (to remove carrier)->Low Pass Filter->Polyphase Clock Sync w/ lowpass proto->CMA Equalizer->File Sink |
(post GNU radio file and block image here) | (post GNU radio file and block image here) | ||
| Line 31: | Line 38: | ||
I decided to process the data in Matlab because I wanted access to all of the analytical tools until I could figure out what I was doing. Update: added some updates to the Manchester decoder. Here's a link to the crappy matlab script I have written to do most of the data processing and extraction. | I decided to process the data in Matlab because I wanted access to all of the analytical tools until I could figure out what I was doing. Update: added some updates to the Manchester decoder. Here's a link to the crappy matlab script I have written to do most of the data processing and extraction. | ||
| − | + | [[Media:POES.m]] | |
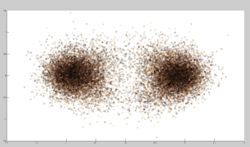
Here's the final constellation of bits. It is still crappy. | Here's the final constellation of bits. It is still crappy. | ||
| − | [[Image:POES_Constellation.jpg|250px]] | + | [[Image:POES_Constellation.jpg|250px]][[File:NOAA15_DSB_POES_Constellation_grid_dots.png|left|thumb|300px|The latest version of the demodulator is a lot less crappy than the first version!]] |
| + | <br clear="all"> | ||
| + | <br clear="all"> | ||
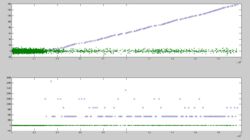
| − | The circles are the locations where the sync word, "11101101 | + | The circles are the locations where the sync word, "11101101 11100010 000" appear. The bottom plot is a diff of the first, showing intervals of 832bits (minor frame length) which proves this is good data. The green dots are where there are Manchester encoding errors (two 1's or two 0's in a row not on a bit boundary). Note that there is no error correction, so I tried to make the manchester decoding as robust as possible by comparing the bit strength of both the first and second bit, and only using the value of the strongest one. The resynchronizer also only reacts if BOTH offending bits are very strong bits. It takes 32 seconds or 3200 minor frames to make up a whole major frame. |
[[Image:Syncword_manchester_errors.jpg|250px]] | [[Image:Syncword_manchester_errors.jpg|250px]] | ||
==Raw IQ Recordings== | ==Raw IQ Recordings== | ||
| − | * http://nebarnix.com/sdr/POES_56k250.raw 56.250khz IEEE 32-bit float raw IQ recording of the | + | * http://nebarnix.com/sdr/POES_56k250.raw 56.250khz IEEE 32-bit float raw IQ recording of the NOAA-15 beacon at 137.35Mhz |
| − | * http://nebarnix.com/sdr/ | + | * http://nebarnix.com/sdr/6_bits_dcblock2.raw IEEE 32-bit float raw IQ output from the GNU radio script at 1 symbol per sample to pull into matlab. One of the best recordings to date, from reddit user _COD32_. NOAA-15 over Europe. |
| − | |||
==Data Extraction and Validation== | ==Data Extraction and Validation== | ||
| Line 51: | Line 59: | ||
[[Image:POES_parity_errors.PNG|left|450px|thumb|A plot of parity errors vs minor frame count. Some nice large error free major frames! (NOAA-15)]] | [[Image:POES_parity_errors.PNG|left|450px|thumb|A plot of parity errors vs minor frame count. Some nice large error free major frames! (NOAA-15)]] | ||
<br clear="both"/> | <br clear="both"/> | ||
| + | |||
| + | ===Embedded Time, Date, Spacecraft ID=== | ||
| + | Each major frame contains a day number as well as day seconds and milliseconds. This can be easily converted into a time and date. | ||
| + | The matlab script spits out the following example (and notes where errors might be happening as I am currently ignoring the parity checks) | ||
| + | It also gives you a local time reference mapping relative time to absolute time. | ||
| + | |||
| + | <pre> | ||
| + | 46.6725 Local Seconds is 55986.685 Spacecraft Day Seconds which is 15:33:6.685 | ||
| + | 78.6725 Local Seconds is 56018.685 Spacecraft Day Seconds which is 15:33:38.685 | ||
| + | 142.6755 Local Seconds is 56082.685 Spacecraft Day Seconds which is 15:34:42.685 | ||
| + | 174.6755 Local Seconds is 56114.685 Spacecraft Day Seconds which is 15:35:14.685 | ||
| + | 206.6755 Local Seconds is 56146.685 Spacecraft Day Seconds which is 15:35:46.685 | ||
| + | 238.6755 Local Seconds is 56178.685 Spacecraft Day Seconds which is 15:36:18.685 | ||
| + | 239.4755 Local Seconds is 39452.805 Spacecraft Day Seconds which is 10:57:32.805 ...but this might be an error | ||
| + | 270.6755 Local Seconds is 56210.685 Spacecraft Day Seconds which is 15:36:50.685 | ||
| + | 302.6755 Local Seconds is 56242.685 Spacecraft Day Seconds which is 15:37:22.685 | ||
| + | 334.6755 Local Seconds is 56274.685 Spacecraft Day Seconds which is 15:37:54.685 | ||
| + | 366.6755 Local Seconds is 56306.685 Spacecraft Day Seconds which is 15:38:26.685 | ||
| + | 398.6755 Local Seconds is 56338.685 Spacecraft Day Seconds which is 15:38:58.685 | ||
| + | Spacecraft: 8=>NOAA-15 | ||
| + | Day: 249 | ||
| + | </pre> | ||
| + | |||
| + | ===HIRS/3 and HIRS/4=== | ||
| + | HIRS is a high resolution (I find this to be a relative term) infrared sounder. It consists of a radiometer, a filter wheel with 20 channels (narrow-band pass frequencies), and a stepped mirror (with 55 positions) all in sync to produce a low resolution multispectral scan of the earth (and cal targets including open space) by mechanical means. | ||
| + | |||
| + | After spending a LOT of time fighting with NOAA-15 data (the best data I have as of Oct 07, 2015) I came to the conclusion that the HIRS/3 instrument was dead*. By loading NOAA-18 data I could confirm that the actual radiometer data is all zeros in the NOAA-15 stream. The NOAA-18 data appears to have lots of values, and each channel can be made into an image 55 pixels wide which would be neat if I had better NOAA-18 data. NOAA-19 uses the HIRS/4 instrument and there are differences, but they seem to be mostly transparent to this script (images are still produced and make sense, though perhaps they are different wavelengths etc). | ||
| + | |||
| + | ====Calculation of pixel size at nadir==== | ||
| + | Mirror views +/- 1080km (from datasheet) -> 2160km wide swath | ||
| + | 2160km / 56 earth views = 38.57km wide per spot at nadir | ||
| + | The spot is ~20km tall (from datasheet) | ||
| + | |||
| + | Vnoaa = 7.428 km/sec | ||
| + | 6.4 seconds = 6.4*7.428 = 47.5392km travel per scan period (pixel height) | ||
| + | |||
| + | Pixels have a ratio of 0.8 pixels, squished longer than tall | ||
| + | |||
| + | [[Image:NOAA18_HIRS_data.png|left|thumb|Plot of HIRS raw data]] | ||
| + | [[Image:HIRS_chan_9_time.png|left|thumb|Crappy NOAA-18 Plot of HIRS Channel #9 (9.71um)]] | ||
| + | [[Image:NOAA18_HIRS_chan_9.png|left|thumb|A newer not-so-crappy NOAA-18 Plot of HIRS Channel #9 (9.71um)]] | ||
| + | <br clear="both" /> | ||
| + | |||
| + | *NOAA website confirms that the filter wheel motor for NOAA-15 has failed. [http://www.ospo.noaa.gov/Operations/POES/NOAA15/hirs.html] | ||
===SEM-2=== | ===SEM-2=== | ||
| Line 61: | Line 113: | ||
===DCS-2=== | ===DCS-2=== | ||
| − | The DCS/2 experiment is a re transmission from mobile platforms (sea buoys, arctic fox collars, sea ice monitors, weather balloons etc etc). The format is not provided, as the instrument is owned and managed by CNES of France. I plotted the raw stream to tease out patterns in the data. What juicy mysteries lay here :) | + | The DCS/2 experiment is a re transmission from mobile platforms at 401.65mhz (sea buoys, arctic fox collars, sea ice monitors, weather balloons etc etc). The format is not provided, as the instrument is owned and managed by CNES of France. I plotted the raw stream to tease out patterns in the data. What juicy mysteries lay here :) |
Interestingly enough, the DCS/2 experiment locks onto the mobile transmitter and records the frequency deviation. Using this data and knowing the orbit of the satellite, it is possible to calculate the location of the mobile platform by using its Doppler shift... Even if we can only take guesses at what it may be, it should be possible to plot these locations on a map if we can just find the right data... | Interestingly enough, the DCS/2 experiment locks onto the mobile transmitter and records the frequency deviation. Using this data and knowing the orbit of the satellite, it is possible to calculate the location of the mobile platform by using its Doppler shift... Even if we can only take guesses at what it may be, it should be possible to plot these locations on a map if we can just find the right data... | ||
| Line 103: | Line 155: | ||
====Analysis of data==== | ====Analysis of data==== | ||
| − | Now an interesting thing happens if we move this data to a spreadsheet and create a field to calculate packet length then sort by it. We can possibly assume that some/most/all transmitters will transmit the same packet structure each time, which means the same length of packet. | + | Now an interesting thing happens if we move this data to a spreadsheet and create a field to calculate packet length then sort by it. We can possibly assume that some/most/all transmitters will transmit the same packet structure each time, which means the same length of packet. *I have discovered that some transmitters have multiple message types and therefore lengths, but that doesn't invalidate this analysis tool, in fact it just means we have MORE data than we at first realize! win! |
These are the 28 byte long packets. There are a lot of them, but if we start to look at the structure some details emerge. Look at the columns and suddenly "E1 E6 D0" pops out more than once. So does "67 8E 80 00" | These are the 28 byte long packets. There are a lot of them, but if we start to look at the structure some details emerge. Look at the columns and suddenly "E1 E6 D0" pops out more than once. So does "67 8E 80 00" | ||
| Line 160: | Line 212: | ||
Byte 5 Middle byte of timestamp<br /> | Byte 5 Middle byte of timestamp<br /> | ||
Byte 6 lower byte of timestamp - granularity 1/100th of a second<br /> | Byte 6 lower byte of timestamp - granularity 1/100th of a second<br /> | ||
| − | Byte 7 | + | Byte 7 TX ID Byte 1<br /> |
| − | Byte 8 | + | Byte 8 TX ID Byte 2<br /> |
| − | Byte 9 Contains 0-16 in the upper nibble with 0's in the lower nibble -- | + | Byte 9 Contains 0-16 in the upper nibble with 0's in the lower nibble -- TX ID Byte 3<br /> |
| − | Byte 10 | + | Byte 10 TX ID Byte 4<br /> |
| − | Byte 11 | + | Byte 11 to N-3 Payload |
The last three bytes are always dynamic. Looks like some data is appended to them. <br /> | The last three bytes are always dynamic. Looks like some data is appended to them. <br /> | ||
| − | Byte N-2 | + | Byte N-2 Doppler shift Byte1<br /> |
| − | Byte N-1 | + | Byte N-1 Doppler shift Byte2<br /> |
| − | Byte N | + | Byte N 7 Upper 2 bits are integer bits for the preceding two bytes, the next 5 are fixed point decimal, and the last is an even parity check for these three bytes<br /> |
| + | |||
| + | ===ADCS=== | ||
| + | NOAA-19 contains the ADCS experiment. It is an advanced design that has bi-directional capabilities. The satellite can send queries and ephemeris data to transmitters so that they can remain in low power modes more efficiently. The format is slightly updated, with the following structure | ||
| + | |||
| + | [[File:ADCS_byte2.png|300px|right]] | ||
| + | Byte 1 Always 214 (0xD6)<br /> | ||
| + | Byte 2 0-9, proportional to the packet length (9 is something else entirely.... VERY long strings of 0xAC)<br /> | ||
| + | Byte 3 received signal strength (see plot)<br /> | ||
| + | Byte 4 Unknown<br /> | ||
| + | Byte 5 Upper byte of timestamp<br /> | ||
| + | Byte 6 Middle byte of timestamp<br /> | ||
| + | Byte 7 lower byte of timestamp - granularity 1/100th of a second<br /> | ||
| + | Byte 8 TX ID Byte 1<br /> | ||
| + | Byte 9 TX ID Byte 2<br /> | ||
| + | Byte 10 Contains 0-16 in the upper nibble with 0's in the lower nibble -- TX ID Byte 3<br /> | ||
| + | Byte 11 TX ID Byte 4<br /> | ||
| + | Byte 12 to N-3 Payload<br /> | ||
| + | The last three bytes encode the doppler shift and the parity, but are encoded as two's complement instead of offset binary<br /> | ||
| + | Byte N-2 Doppler shift Byte1<br /> | ||
| + | Byte N-1 Doppler shift Byte2<br /> | ||
| + | Byte N 7 Upper 2 bits are integer bits for the preceding two bytes, the next 5 are fixed point decimal, and the last is an even parity check for these three bytes<br /> | ||
| + | |||
| + | ==Further Analysis== | ||
| + | THE REST OF THE DCS DATA ON THIS PAGE HAS BEEN MOVED TO [[project_desert_tortoise | PROJECT DESERT TORTOISE]] PAGE!! Trying to contain the scope creep =D | ||
==Todo== | ==Todo== | ||
| − | * | + | *Port GNU radio script to DSP code DONE |
*Maybe port this matlab script into sci-py and integrate directly into GNU radio block for realtime plotting and processing etc | *Maybe port this matlab script into sci-py and integrate directly into GNU radio block for realtime plotting and processing etc | ||
| − | * | + | *Automate or improve automation of DCS geolocation (make it easier to map ALL transmitters with 3+ points in a single pass) |
Latest revision as of 21:20, 23 November 2020
Problem Statement
While listening to NOAA APT signals I noticed a strange telemetry signal at 137.35 and 137.77 that tracked NOAA POES sats. At first I thought it was a second sat, but then I realized that the doppler shifts matched too closely. I found the handbook for the satellite constellation, which makes mention of a DSB or TIP signal
Latest News
- I gave a talk at HeatSync Labs on this project! "Reverse Engineering NOAA and ARGOS Satellite - Hot Topics - 9th September 2016"
- Matlab code has been ported to a standalone C program that anyone can use! The Project Desert Tortoise Github Page!
- Output of the demodulator can be opened with Telemetry Explorer, a QT based application with more and more functionality added all the time.
Research
I can't actually find any instance of anyone using SDR to decode this signal. I decided that this needed to change :)
I found these documents which describe the modulation and format. TIP stands for "Tiros Information Processor" (because the predicessors to NOAA sats were called TIROS) and is also called the DSB "Direct Sounder Broadcast" as it contains information about the earth environment. [1] [2]
Modulation Format
I discovered that this is a very old modulation scheme, dating back to at least the late 60's. The scheme is a BPSK that uses a modulation index of 67 degrees to preserves the carrier for tracking purposes. It is also Manchester encoded, which means that even though the stream is 8320 bps, it is encoded using double the number of symbols, or 16,640 sps. The reason for this strange number is that there are 10 minor frames per second, and there happen to be 104 bytes per frame. Math :)
GNU Radio Script
I wrote a GNU radio workflow to prepare the data for demodulation. http://nebarnix.com/sdr/latest_POES.grc
File Source->Throttle->AGC2->Carrier Tracking PLL->DC Block Filter (to remove carrier)->Low Pass Filter->Polyphase Clock Sync w/ lowpass proto->CMA Equalizer->File Sink (post GNU radio file and block image here)
Matlab Script
I decided to process the data in Matlab because I wanted access to all of the analytical tools until I could figure out what I was doing. Update: added some updates to the Manchester decoder. Here's a link to the crappy matlab script I have written to do most of the data processing and extraction.
Here's the final constellation of bits. It is still crappy.
The circles are the locations where the sync word, "11101101 11100010 000" appear. The bottom plot is a diff of the first, showing intervals of 832bits (minor frame length) which proves this is good data. The green dots are where there are Manchester encoding errors (two 1's or two 0's in a row not on a bit boundary). Note that there is no error correction, so I tried to make the manchester decoding as robust as possible by comparing the bit strength of both the first and second bit, and only using the value of the strongest one. The resynchronizer also only reacts if BOTH offending bits are very strong bits. It takes 32 seconds or 3200 minor frames to make up a whole major frame.
Raw IQ Recordings
- http://nebarnix.com/sdr/POES_56k250.raw 56.250khz IEEE 32-bit float raw IQ recording of the NOAA-15 beacon at 137.35Mhz
- http://nebarnix.com/sdr/6_bits_dcblock2.raw IEEE 32-bit float raw IQ output from the GNU radio script at 1 symbol per sample to pull into matlab. One of the best recordings to date, from reddit user _COD32_. NOAA-15 over Europe.
Data Extraction and Validation
I have updated the matlab script to extract a few of the instruments embedded in the stream! First, there is a parity byte in each minor frame that splits the frame into 6 chunks and checks each chunk for errors. One could in theory zero out or at least flag questionable chunks when plotting to more easily spot bad points.
Embedded Time, Date, Spacecraft ID
Each major frame contains a day number as well as day seconds and milliseconds. This can be easily converted into a time and date. The matlab script spits out the following example (and notes where errors might be happening as I am currently ignoring the parity checks) It also gives you a local time reference mapping relative time to absolute time.
46.6725 Local Seconds is 55986.685 Spacecraft Day Seconds which is 15:33:6.685
78.6725 Local Seconds is 56018.685 Spacecraft Day Seconds which is 15:33:38.685
142.6755 Local Seconds is 56082.685 Spacecraft Day Seconds which is 15:34:42.685
174.6755 Local Seconds is 56114.685 Spacecraft Day Seconds which is 15:35:14.685
206.6755 Local Seconds is 56146.685 Spacecraft Day Seconds which is 15:35:46.685
238.6755 Local Seconds is 56178.685 Spacecraft Day Seconds which is 15:36:18.685
239.4755 Local Seconds is 39452.805 Spacecraft Day Seconds which is 10:57:32.805 ...but this might be an error
270.6755 Local Seconds is 56210.685 Spacecraft Day Seconds which is 15:36:50.685
302.6755 Local Seconds is 56242.685 Spacecraft Day Seconds which is 15:37:22.685
334.6755 Local Seconds is 56274.685 Spacecraft Day Seconds which is 15:37:54.685
366.6755 Local Seconds is 56306.685 Spacecraft Day Seconds which is 15:38:26.685
398.6755 Local Seconds is 56338.685 Spacecraft Day Seconds which is 15:38:58.685
Spacecraft: 8=>NOAA-15
Day: 249
HIRS/3 and HIRS/4
HIRS is a high resolution (I find this to be a relative term) infrared sounder. It consists of a radiometer, a filter wheel with 20 channels (narrow-band pass frequencies), and a stepped mirror (with 55 positions) all in sync to produce a low resolution multispectral scan of the earth (and cal targets including open space) by mechanical means.
After spending a LOT of time fighting with NOAA-15 data (the best data I have as of Oct 07, 2015) I came to the conclusion that the HIRS/3 instrument was dead*. By loading NOAA-18 data I could confirm that the actual radiometer data is all zeros in the NOAA-15 stream. The NOAA-18 data appears to have lots of values, and each channel can be made into an image 55 pixels wide which would be neat if I had better NOAA-18 data. NOAA-19 uses the HIRS/4 instrument and there are differences, but they seem to be mostly transparent to this script (images are still produced and make sense, though perhaps they are different wavelengths etc).
Calculation of pixel size at nadir
Mirror views +/- 1080km (from datasheet) -> 2160km wide swath 2160km / 56 earth views = 38.57km wide per spot at nadir The spot is ~20km tall (from datasheet)
Vnoaa = 7.428 km/sec 6.4 seconds = 6.4*7.428 = 47.5392km travel per scan period (pixel height)
Pixels have a ratio of 0.8 pixels, squished longer than tall
- NOAA website confirms that the filter wheel motor for NOAA-15 has failed. [3]
SEM-2
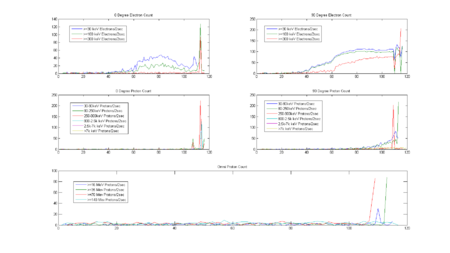
The SEM-2 (Space Environment Monitor) contains two experiments, the MEPED (Medium Energy Proton and Electron Detector) and the TED (Total Energy Detector) The following MEPED and TED data was taken as the NOAA15 spacecraft flew north from Hungary to Scandinavia and into the auroral oval.
DCS-2
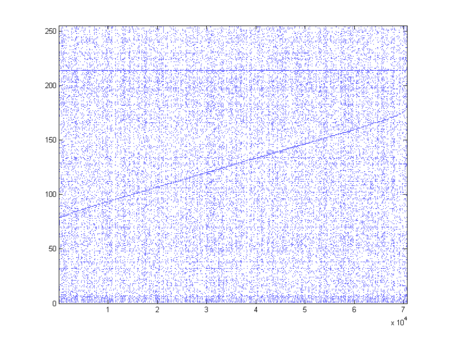
The DCS/2 experiment is a re transmission from mobile platforms at 401.65mhz (sea buoys, arctic fox collars, sea ice monitors, weather balloons etc etc). The format is not provided, as the instrument is owned and managed by CNES of France. I plotted the raw stream to tease out patterns in the data. What juicy mysteries lay here :)
Interestingly enough, the DCS/2 experiment locks onto the mobile transmitter and records the frequency deviation. Using this data and knowing the orbit of the satellite, it is possible to calculate the location of the mobile platform by using its Doppler shift... Even if we can only take guesses at what it may be, it should be possible to plot these locations on a map if we can just find the right data...
Looking at this plot, it is easy to see that there are two very clear trends. There is the value 214 (0xD6 or 11010110) that appears over and over again and there is also what looks like a linearly increasing value, perhaps a counter or clock. Looking at the data, a lot of instances of 0xD6 are preceeding by lots and lots of zeros. This must be the message start sync word! Searching for "00 00 D6" (which probably excludes packets that are closely spaced, but captures most of them) and grabbing the following 64 bytes (surely enough bytes to see any patterns in the data) yields a long dist of messages, some of which are longer than 64 bytes and some that are very small. All are at least 9 bytes long, and have several fixed values (which may be dynamic between spacecraft or data-sets, remember, this is only one NOAA-15 pass we are looking at)
An example of the messages follows (the entire list can be found here http://nebarnix.com/sdr/DCS_64B.txt): Actually here's a better example with the packets trimmed to avoid duplicates and trailing zeros. http://nebarnix.com/sdr/DCS_6_Europe_64B.txt
D6 01 CB A6 77 74 CF 18 30 00 3A 62 D0 82 E2 F4 C4 3A 15 C1 57 47 04 AE 45 44 41 70 23 8E 08 E3 B1 C8 E4 71 40 9C 31 94 00 00 00 00 00 00 00 00 00 00 00 00 00 00 00 00 00 00 D6 04 FA 46 77 7E 68
D6 04 FA 46 77 7E 68 88 B0 E1 00 00 00 00 00 00 00 00 00 00 00 00 00 00 00 00 00 00 00 00 00 00 00 00 00 00 00 00 00 00 00 92 9D 8B 00 00 00 00 00 00 00 00 00 00 D6 01 22 46 77 CA 8F 9E A0 8B 40
D6 01 22 46 77 CA 8F 9E A0 8B 40 00 00 C4 E8 2F 00 00 00 00 00 00 00 00 00 00 00 00 00 00 00 00 00 00 00 00 00 00 00 00 00 00 00 00 00 00 00 00 00 00 00 00 00 00 00 00 00 00 00 00 00 00 00 00 00
D6 01 0A 26 78 14 D5 92 00 BE B7 C8 B9 B5 E8 29 00 00 00 00 00 00 D6 06 C3 06 77 EB B7 D9 80 AD 35 4D BE CD BE F5 A2 C3 B9 CB BB 7C 53 C1 21 6D D8 F7 D1 55 F5 AD 3F B0 59 C7 79 84 A6 84 D6 00 A3
D6 06 C3 06 77 EB B7 D9 80 AD 35 4D BE CD BE F5 A2 C3 B9 CB BB 7C 53 C1 21 6D D8 F7 D1 55 F5 AD 3F B0 59 C7 79 84 A6 84 D6 00 A3 A6 77 F5 66 3D E0 4C 10 11 F1 CB 78 63 D6 63 D4 DD 39 FC 6E AC D6
D6 02 09 86 78 63 C0 AF D0 02 97 29 BC 96 2A BF 00 00 00 00 00 00 00 00 00 00 00 00 00 00 00 00 00 00 00 00 00 00 00 00 00 00 00 00 00 00 00 00 00 00 00 00 00 00 00 00 00 00 00 00 00 00 00 00 D6
D6 06 F3 66 78 48 6D 9E 60 35 E3 00 00 00 00 00 00 03 00 1B 34 00 00 00 00 00 00 32 01 B3 80 00 00 00 00 00 03 20 1B A0 91 A0 0E 6B 00 00 00 00 00 00 00 00 00 00 00 00 00 00 00 00 00 00 00 00 00
D6 01 6A A6 78 84 69 44 60 6A 84 12 41 AC B5 DE B2 7D A7 B5 F1 E4 85 CB 5D 81 13 83 D6 00 C4 A6 78 6C CE F7 00 F2 34 A1 4A FA E1 18 90 32 15 72 5C 85 C8 B9 04 57 45 70 00 00 00 00 00 00 00 01 20
D6 06 C4 26 78 B8 B7 0F 60 79 36 E1 F6 E5 48 BE D9 76 6E F7 19 7B FB 48 39 45 6B 44 FB D7 14 FF 6D 66 B1 E4 FF 47 03 AA D6 00 C5 C6 78 86 22 A3 50 35 3D 46 C4 2B 02 A8 66 5C C4 DC 38 66 71 5E EC
D6 01 FB 06 78 CF D8 62 70 AD DF 14 2E 02 88 03 92 57 71 93 81 7B 2B A7 AF 73 3B F3 8B B5 FB BB BF BB BE FF FB FF FF FF FC C1 FD 0F D6 03 C1 86 78 E2 B6 B3 50 D4 3C 03 47 BF 96 EC 20 D0 A5 A5 C9
D6 02 CA 46 78 FA B7 47 F0 F2 3F 6E C1 3C EC 17 34 06 02 F7 74 39 DC 85 97 B8 66 29 E7 FF 7F 80 77 F0 1E 69 82 63 88 81 D6 04 CD 86 79 01 90 63 50 F2 3A 00 D3 81 17 2E B4 52 BF 3A 23 99 CC B1 B5
Updated list with better processing and line numbers
1110: D6 05 03 77 0E 0E D6 4C 60 C7 AD C0 C0 B4 13 32
1111: D6 03 C5 17 0E 01 B8 03 30 5F 39 CF 10 B3 EB 01 D6 F0 82 DE 37 A1 73 5A E3 C9 0C E1 75 78 A9 FA E7 70 07 70 5E 55 BF 67
1112: D6 00 93 97 0E 15 5D 93 80 AD D8 B5 F7 C6 AD 42 84 F3 C6 0A 5D D8 00 7F 4E C1 FF FA 00 83 DA 0C
1113: D6 02 3A F7 0E 2F B8 03 30 00 FF 80 E8 26 B8 03 B8 A9 F0 90
1114: D6 04 AE 57 0E 1F 69 DF 20 4C 08 12 61 C2 89 DD B6 28 4A A0 7C E8 E9 D3 95 56 8B 25 27 83 FB 81 7B 6C 5D E3
1115: D6 05 C3 77 0E 34 2F 64 00 BE 36 DD 5A A1 BE 0A D7 9B 9F 65 BA 94 8D E5 52 19 F8 EA DB 6E D8 59 0C 84 7E 1A 6A 35 88 C0
1116: D6 00 04 17 0E 7C D4 33 80 00 00 00 00 87 DE 28
1117: D6 01 CD B7 0E 8F 9F B6 B0 6A 30 F9 BE 1D AC 69 FB 69 FB 91 87 57 E4 79 F3 BC AE B4 A8 80 E7 06 82 C4 C3 33 57 C0 03 F9
1118: D6 07 CB B7 0E 9B D3 DA 60 8B 3A 4C AA B5 D1 17 D2 BE 15 72 5C 85 C8 B9 04 57 45 70 00 00 00 00 00 00 00 01 40 9D 95 40
1119: D6 02 CB 97 0E A7 B6 DD 10 BE 32 F3 22 C9 12 49 2D 2C 67 C8 DD C5 51 89 0B B5 6F 73 C1 3A F3 7E 36 D5 14 FA 2C 76 A1 4D
1120: D6 03 F2 B7 0E A7 07 D7 B0 D4 92 8B 1B 5B 98 30 A9 33 79 FB 86 49 8E 71 69 B0 CA 36 CE CC 94 17 8E 41 D9 92 C2 F1 C8 BE B5 AB 82 F8
Analysis of data
Now an interesting thing happens if we move this data to a spreadsheet and create a field to calculate packet length then sort by it. We can possibly assume that some/most/all transmitters will transmit the same packet structure each time, which means the same length of packet. *I have discovered that some transmitters have multiple message types and therefore lengths, but that doesn't invalidate this analysis tool, in fact it just means we have MORE data than we at first realize! win!
These are the 28 byte long packets. There are a lot of them, but if we start to look at the structure some details emerge. Look at the columns and suddenly "E1 E6 D0" pops out more than once. So does "67 8E 80 00"
22	28	D6	05	61	D6	9F	04	69	59	D0	0C	EE	CF	68	76	48	8B	55	3C	51	4A	85	64	51	4A	25	7C	CD	22
28	28	D6	00	62	B6	9F	F7	25	49	A0	8B	A0	54	96	C5	D3	A3	DD	67	D2	22	98	A6	25	49	25	46	02	FA
153	28	D6	00	64	16	AA	C2	22	9B	20	8B	AE	5F	4F	C2	7D	D0	88	CC	8C	D8	89	91	91	0B	36	45	8F	AF
282	28	D6	03	66	76	B8	A7	69	44	60	6A	84	12	41	A0	DB	EF	D2	7D	A7	B5	F6	2B	AD	B4	A2	89	A0	C8
354	28	D6	03	64	16	BE	20	**67	**8E	**80	**00	2F	12	14	A1	CB	DD	6C	55	8B	32	2C	F1	D5	97	1A	98	9F	73
516	28	D6	02	6A	B6	D4	D0	*E1	*E6	*D0	*BE	A3	E0	F7	9F	80	0E	EE	C0	0E	E2	00	3F	57	40	8F	BD	73	94
568	28	D6	06	62	16	D8	6B	CF	A5	A0	26	A3	60	12	1E	01	0E	00	27	09	F4	5F	FF	FF	FF	3E	BF	90	F4
585	28	D6	00	64	B6	D9	D8	B6	D5	70	C7	A9	75	EF	3B	E8	DE	B9	7A	4E	1A	23	A2	B6	D7	B6	BA	37	FC
617	28	D6	07	6D	F6	DC	A5	69	44	60	6A	84	12	41	A0	13	EF	F2	7D	A7	B5	F6	2B	B5	B4	A2	83	13	FC
681	28	D6	07	6D	36	E2	F1	**67	**8E	**80	**00	2F	12	14	A5	CB	DD	6C	55	8B	36	2C	F1	EC	F7	16	90	E7	B1
686	28	D6	07	6A	F6	E3	48	CE	E5	A0	12	23	C2	FF	F2	E1	00	00	EE	00	0E	0E	E5	FF	F9	E4	BD	55	6C
765	28	D6	07	6A	56	EA	0F	25	49	A0	8B	A0	54	96	C5	53	A3	DD	67	D2	22	98	A4	25	49	25	3C	E2	5A
853	28	D6	06	F2	B6	F1	AA	F1	19	B0	8B	96	4B	0E	06	C7	00	B0	F1	21	4A	80	00	00	00	00	86	50	4C
936	28	D6	05	63	16	FC	49	D0	A7	30	C7	42	72	01	59	6C	24	B0	1C	40	00	00	00	00	56	00	58	DA	A0
989	28	D6	00	63	97	01	75	69	44	60	6A	84	12	41	A5	83	EE	52	7D	A7	B5	F6	2B	85	B4	A2	80	D9	95
1047	28	D6	03	65	97	07	C1	**67	**8E	**80	**00	2F	12	14	AD	CB	DD	6C	55	8B	38	2C	F1	D2	D7	11	8C	24	B0
1103	28	D6	07	6C	D7	0D	A1	81	BA	D0	96	D6	1F	3E	00	17	00	1C	88	C0	00	00	00	1D	0E	60	90	5D	AB
1109	28	D6	07	6D	97	0D	DF	9F	AD	20	98	A1	8A	12	52	4D	58	BA	D3	69	52	8D	7D	9F	AD	9F	80	DC	44
1170	28	D6	07	6B	37	13	16	D0	A7	30	C7	42	72	01	59	6C	24	B0	1C	40	00	00	00	00	56	00	57	6D	44
1212	28	D6	04	6A	77	16	80	B7	2C	80	D4	A9	D9	96	57	CD	C2	69	1A	6C	40	38	4B	95	3D	36	59	8C	A4
1260	28	D6	00	63	B7	1B	41	01	FB	F0	79	8F	AB	DA	64	94	F3	48	78	C3	3F	02	01	00	00	00	A4	46	8E
1346	28	D6	04	6A	B7	22	F5	CE	16	C0	79	E6	02	4C	BA	59	DC	F2	11	EF	37	03	AD	89	48	00	7F	1B	A1
1386	28	D6	03	62	F7	26	46	69	44	60	6A	84	12	41	A0	FB	EF	22	7D	A7	B5	F6	2B	8D	B4	A2	80	13	BE
1392	28	D6	05	66	77	26	A7	B6	D7	70	C7	A8	B5	EF	7B	FE	5E	B9	62	4E	08	22	E2	B6	D7	B6	AC	B8	03
1406	28	D6	04	6C	17	27	F5	*E1	*E6	*D0	*BE	A4	20	FF	FF	1E	0E	00	10	0E	E0	00	00	EE	00	26	A6	97	FD
1409	28	D6	00	63	37	28	47	CE	19	90	26	DC	02	4C	BA	59	E6	F5	11	E9	B7	EE	30	89	48	00	7E	9D	D5
1461	28	D6	06	64	D7	2C	92	**67	**8E	**80	**00	2F	12	14	A1	CB	DD	6C	55	8B	3C	2C	F1	D0	37	00	89	C9	79
If we sort on these presumed transmitter ID bytes we can assume that we have isolated individual data sets spanning the 400 seconds that the satellite was overhead. Two such transmitters in this data set are shown below
354	28	D6	03	64	16	BE	20	67	8E	80	00	2F	12	14	A1	CB	DD	6C	55	8B	32	2C	F1	D5	97	1A	98	9F	73
681	28	D6	07	6D	36	E2	F1	67	8E	80	00	2F	12	14	A5	CB	DD	6C	55	8B	36	2C	F1	EC	F7	16	90	E7	B1
1047	28	D6	03	65	97	07	C1	67	8E	80	00	2F	12	14	AD	CB	DD	6C	55	8B	38	2C	F1	D2	D7	11	8C	24	B0
1461	28	D6	06	64	D7	2C	92	67	8E	80	00	2F	12	14	A1	CB	DD	6C	55	8B	3C	2C	F1	D0	37	00	89	C9	79

282	28	D6	03	66	76	B8	A7	69	44	60	6A	84	12	41	A0	DB	EF	D2	7D	A7	B5	F6	2B	AD	B4	A2	89	A0	C8
617	28	D6	07	6D	F6	DC	A5	69	44	60	6A	84	12	41	A0	13	EF	F2	7D	A7	B5	F6	2B	B5	B4	A2	83	13	FC
989	28	D6	00	63	97	01	75	69	44	60	6A	84	12	41	A5	83	EE	52	7D	A7	B5	F6	2B	85	B4	A2	80	D9	95
1386	28	D6	03	62	F7	26	46	69	44	60	6A	84	12	41	A0	FB	EF	22	7D	A7	B5	F6	2B	8D	B4	A2	80	13	BE
One can see that large bits of data did not change, perhaps several hundred seconds is not enough time for the parameter to experience disruption.
Further Analysis
Byte 1 Always 214 (0xD6)
Byte 2 Upper nibble always 0, Lower nibble 0-7, perhaps the sat receiver channel? We know from data sheets there are 8 channels
Byte 3 Upper nibble is related to packet length, which is between 4 and 32 bytes in 4 byte increments not including the header and suffix
Byte 4 Contains 0-7 channels in the upper 3 bytes the lower 5 bits contain the upper nibble+ of the counter (rollover behavior into this byte was observed)
Byte 5 Middle byte of timestamp
Byte 6 lower byte of timestamp - granularity 1/100th of a second
Byte 7 TX ID Byte 1
Byte 8 TX ID Byte 2
Byte 9 Contains 0-16 in the upper nibble with 0's in the lower nibble -- TX ID Byte 3
Byte 10 TX ID Byte 4
Byte 11 to N-3 Payload
The last three bytes are always dynamic. Looks like some data is appended to them.
Byte N-2 Doppler shift Byte1
Byte N-1 Doppler shift Byte2
Byte N 7 Upper 2 bits are integer bits for the preceding two bytes, the next 5 are fixed point decimal, and the last is an even parity check for these three bytes
ADCS
NOAA-19 contains the ADCS experiment. It is an advanced design that has bi-directional capabilities. The satellite can send queries and ephemeris data to transmitters so that they can remain in low power modes more efficiently. The format is slightly updated, with the following structure
Byte 1 Always 214 (0xD6)
Byte 2 0-9, proportional to the packet length (9 is something else entirely.... VERY long strings of 0xAC)
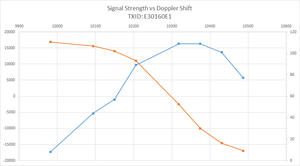
Byte 3 received signal strength (see plot)
Byte 4 Unknown
Byte 5 Upper byte of timestamp
Byte 6 Middle byte of timestamp
Byte 7 lower byte of timestamp - granularity 1/100th of a second
Byte 8 TX ID Byte 1
Byte 9 TX ID Byte 2
Byte 10 Contains 0-16 in the upper nibble with 0's in the lower nibble -- TX ID Byte 3
Byte 11 TX ID Byte 4
Byte 12 to N-3 Payload
The last three bytes encode the doppler shift and the parity, but are encoded as two's complement instead of offset binary
Byte N-2 Doppler shift Byte1
Byte N-1 Doppler shift Byte2
Byte N 7 Upper 2 bits are integer bits for the preceding two bytes, the next 5 are fixed point decimal, and the last is an even parity check for these three bytes
Further Analysis
THE REST OF THE DCS DATA ON THIS PAGE HAS BEEN MOVED TO PROJECT DESERT TORTOISE PAGE!! Trying to contain the scope creep =D
Todo
- Port GNU radio script to DSP code DONE
- Maybe port this matlab script into sci-py and integrate directly into GNU radio block for realtime plotting and processing etc
- Automate or improve automation of DCS geolocation (make it easier to map ALL transmitters with 3+ points in a single pass)
